Government Spending 2008-2011

Data to work with and student worksheets on the theme of Government spending. Data is provided based on both 2008 and 2011 figures — all have been sourced from the Central Statistics Office.
The resources have been designed so that you can use them in whatever context or way that you wish. The data are sourced from the Central Statistics Office. In the Excel file, you will find data for the years 1973, 1990, 2008 and 2011. These are available for you to use to make comparisons over time. Note the changes in units from 2008 onwards from millions to billions.
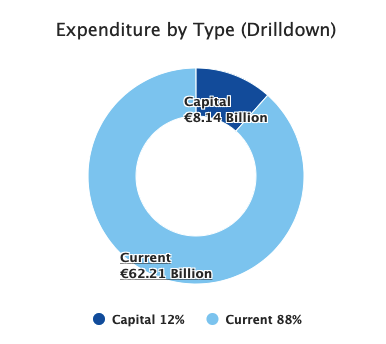
Along with these data tables is a pie chart to show the spending for 2011. This could be used as an OHP/Whiteboard exercise where students guess and reveal hidden labels/titles. The other two worksheets give exercises based on the 2011 data. The activities themselves are self-explanatory and can be used as either main activities or homework.


