BACK TO GET DATA
2010/2011
Latest
CensusAtSchool 10 Results
Results from 2010/2011 survey are now available and they’re fascinating. Over 10,000 young people in Irish schools completed the CensusAtSchool 10 questionnaire between September 2010 and June 2011. 7,211 Secondary School attendees completed the CensusAtSchool 10 questionnaire between August 2010 and June 2011.This represents 1.9% of the overall secondary school population. The questionnaire covered a wide variety of topics ranging from favourite subjects, sports teams, methods of communication and travel to school times.
– Interesting findings from results:
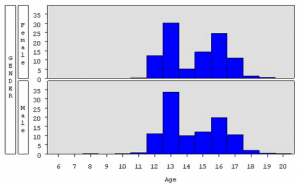
- Age Distribution of Phase 10 Online Survey
46% of those completing the Phase 10 survey were female as opposed to 54% in the Phase 9 survey. The age range was between 12 and 20 inclusive.
- Scatter Plot of Height vs Foot Length
Students were asked their age, height, foot length and arm span. There was a slight positive association between height and foot length, where taller students tended to also have a longer foot. The correlation coefficient was 0.34.

- Scatter Plot of Height vs Arm Span
There was a stronger positive correlation association between height and Arm Span, where taller students tended to have a longer Arm Span. The correlation coefficient was 0.46

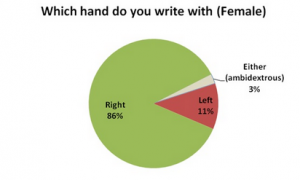
- Which hand do you write with (Female)
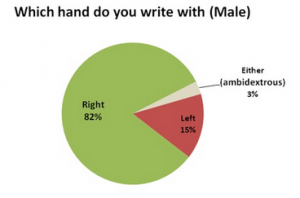
Students who responded were predominantly right handed. 82% of males and 86% of females write with their right hand. Interestingly 4% more males are left handed than females
- Which hand do you write with (Male)
4% more males write with their left hands than females
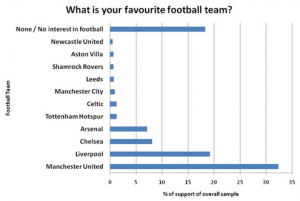
- What is your favourite football team?
The most popular football team in the survey was Manchester United. 25% of the females that responded stated they had no interest in football while 12% of males stated they had no interest in football. A total 107 different football teams were entered in the survey. The remaining 95 teams had less than 0.5% support each.
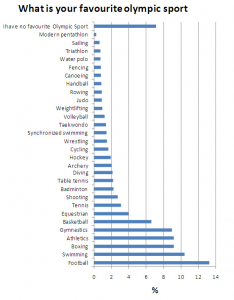
- What is your favourite Olympic sport
Football was also the favourite Olympic sport. All sports that the students mentioned in the survey are included in the results below.
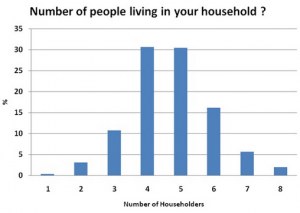
- Number of people living in your household?
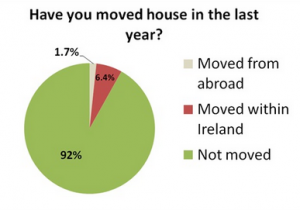
- Have you moved house in the last year?
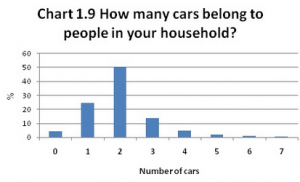
- How many cars belong to people in your household?
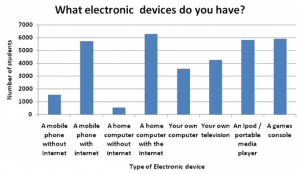
- What electronic devices do you have?
87% of respondents to the survey had a home computer with access to the internet and 82% of the respondents have a games console. Of the respondents who have a computer with internet access 50% also responded that they owned their own computer.
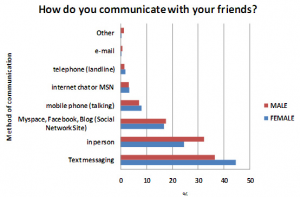
- How do you communicate with your friends?
Male students in our questionnaire indicated they spend a greater proportion communciating in person while female students use text messaging a greater proportion of the time.
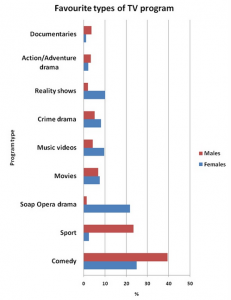
- What is your favourite type of TV program?
Comedy is the favourite type of TV program enjoyed by both female and male respondents.
- What is the main way you keep up with the news?
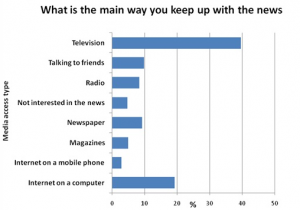
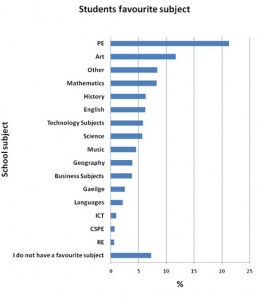
- Students favourite subject
Female students preferred Art, Music and English to male students. The male respondents favourite subjects are Physical Education (PE) and technology subjects.
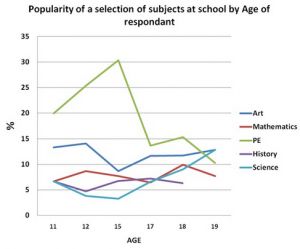
- Popularity of a selection of subjects at school by age of respondent
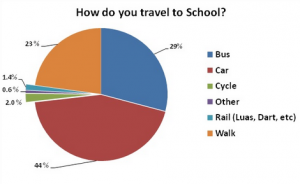
- How do you travel to school?
- Average times of different methods of travelling to school
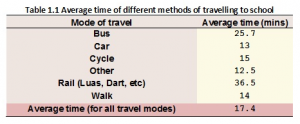
- The time it takes to get to School by County of School
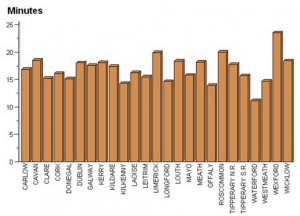
Chart footnote 1: The number of respondents in this table refers to the population of the sample that could be matched to the Department of Education’s School Roll number in order to establish which county the school was based in using the Departments school address
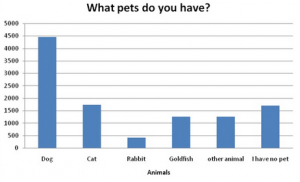
Chart footnote 2: No matched respondents from Monaghan or Sligo - What pets do you have?
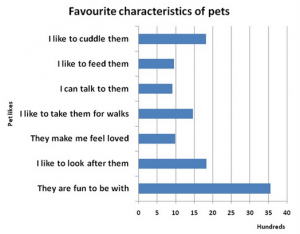
- Favourite characteristics of pets
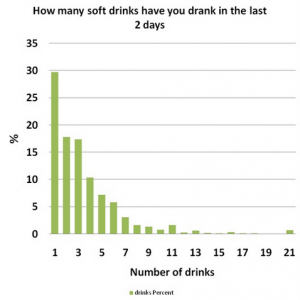
- How many soft drinks have you drank in the last 2 days?
50 respondents indicated they have consumed more than 20 soft drinks over the last two days.
