BACK TO RESOURCES
Statistics
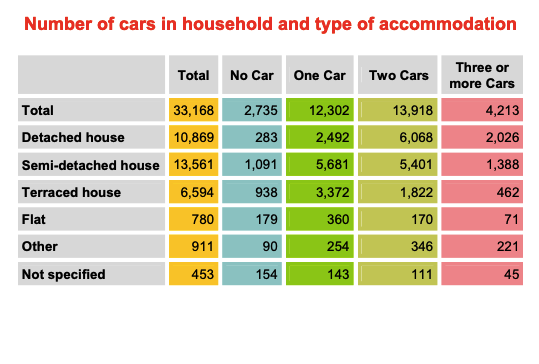
Cars Galore
Comparing National Statistic data to CensusAtSchool data on car ownership and traffic. Interpretation, line graphs, and in the extension task, comparative bar charts.