BACK TO RESOURCES
Statistics
Sample Handling Data Unit
Using the CensusAtSchool project as a tool in delivering data handling in the classroom.
The aim of this lesson was to:
- consolidate the ideas on data handling;
- allow students to use ICT as a tool in order to help their calculations and presentation;
- and most importantly let students explore the data handling cycle using their own data, thus making it more relevant.
Students had previously struggled with analysing data and producing graphs (in particular pie charts) so the objective of this activity was to allow pupils to focus on interpreting data and graphs effectively, whilst allowing ICT to do the ‘hard’ work for them.
Some pointers:
- Downloadable files include an overview of the lesson plans and the complete Excel file of the student’s data with a selection of their graphs and statistics. The data could be useful in making comparisons with other data collected and give ideas about how to manipulate the data. NB This Excel workbook includes multiple sheets, which you will need to access by using the tabs at the bottom of the screen.
- It is assumed that readers of this will be familiar with the CensusAtSchool site, resources available, methods of data collection and using ICT to evaluate data. When your dataset is returned, it will need decoding for the students. (see the coding sheets on the website for how to do this). It can be time consuming, but if left in coded form some students may struggle to interpret the data. A nice idea is to print out the entire datasheet, stick it together, and put onto the classroom wall (a smaller version can be copied for individuals). This allows pupils to appreciate the sheer size of their data and they enjoy simple tasks like identifying themselves on the sheet. Manipulating the data electronically into a useable form often requires the use of the COUNTIF (Excel) function. This can be tricky for some students, so consider what data will need to be formatted and give the students the sorted sheet.
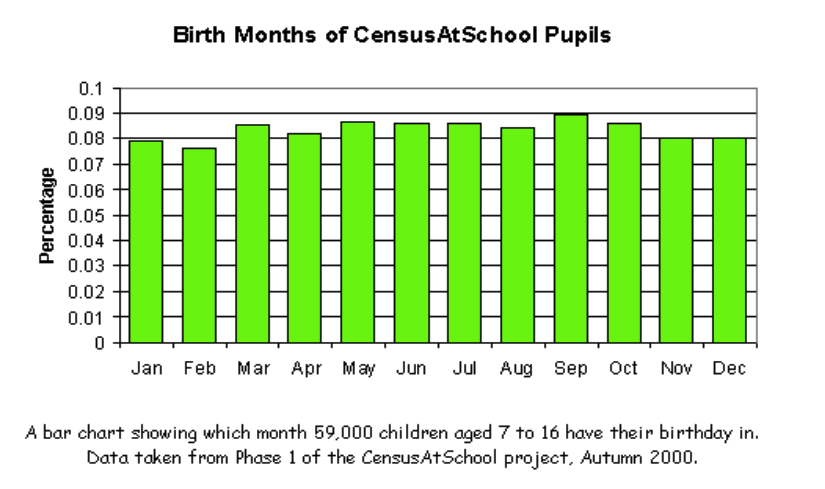
- The class compared birth months of year 8 and 9 students and the total data from Phase 1 of CensusAtSchool; postcodes between the two years; height against foot size for both years and Phase 1, and ideas on threats to woodland. (This can be seen in the data file). The students also did their own analysis of particular data of interest to themselves.
- Following the analysis, a wall display was put up (using colour if possible is great) around the classroom. Questions were written on the printouts to help the students try and interpret the data. (E.g. Which is the most popular month to be born in? Can you think why? Is this the same for the year 8 and 9 data? Why might there be differences?) Students spend the lesson/s looking at the data and graphs on the classroom walls, along with any data/graphs the have produced individually. The students worked in pairs to produce a report about their findings and conclusions (One couple made a PowerPoint presentation). They spent two lessons on their write-ups. Towards the end of the second of these the class had a feedback session where pupils shared their ideas with others and gave reasons for their conclusions.
- Drawing conclusions from data is often difficult, you cannot always be sure you are right. However, using real data that is about the students makes the conclusions they draw more meaningful, and it is easier for students to come up with sensible reasons. The Year 9 students were particularly good at drawing comparisons from their Height v Footsize scattergraph and the other graphs. They noticed that there were a few points on their graph, which didn’t fit the overall trend. They immediately realised that there had been inaccuracies in their measurements and since they had collected the data themselves they could work out where the mistakes were (they had used the wrong scale/side on the metre stick and therefore measured the complement of 100 for the actual height). This gave the students useful insight into why it is important to be accurate in data collection. If students have been involved in the data collection they are often aware of the sorts of results they can expect. When the pie chart about ‘threat to woodland’ was created the students had a feeling it wasn’t right. This led to an interesting discussion about how they had decoded and manipulated the data. Students rarely challenge the methods they use for data handling, since they usually rote learn textbook methods. This ‘mistake’ really allowed students the opportunity to see the true essence of handling data and that there is a choice in how you might use data.
- Students later seemed to better recall the ICT techniques they had used within the project. I believe this is due to the fact that they learnt the methods, because they needed them, not as a skill that they may use at some point in the future. It was satisfying to see pupils who had previously struggled to organize and interpret data, use ICT in such a purposeful manner.