A worksheet looking at how questions can bias the response. Useful for students to consider as they express, justify and defend themselves.
Rotate your phone
Once that’s done you’ll be able to experience the CensusAtSchool website perfectly.
Once that’s done you’ll be able to experience the CensusAtSchool website perfectly.
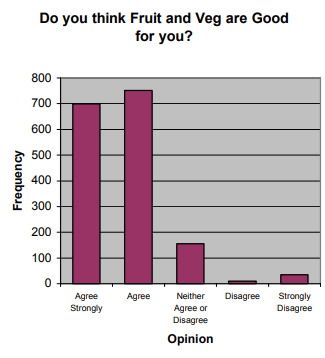
A worksheet looking at how questions can bias the response. Useful for students to consider as they express, justify and defend themselves.
Here is some raw data for students to interpret, calculate and present findings from. The activity leads to comparisons between different localities around the country and invites students to also collect their own data to compare.
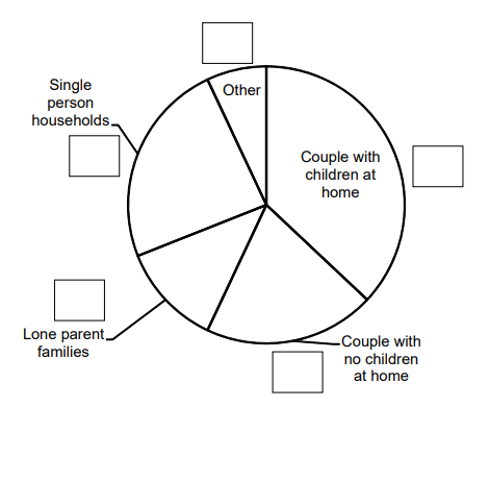
The 2014 CensusAtSchool questionnaire marked the 20th anniversary of the International Year of the Family. Family plays a very important role in all our lives, but how exactly has family structure changed in Ireland in the last 40 years?
Pie charts provide a useful and visual way of comparing the types of families in Ireland back in 1981 with those in 2011. This lesson plan and worksheet contains data from the Central Statistics Office and offers opportunities for students to understand more about pie charts and the role that families play in our society.
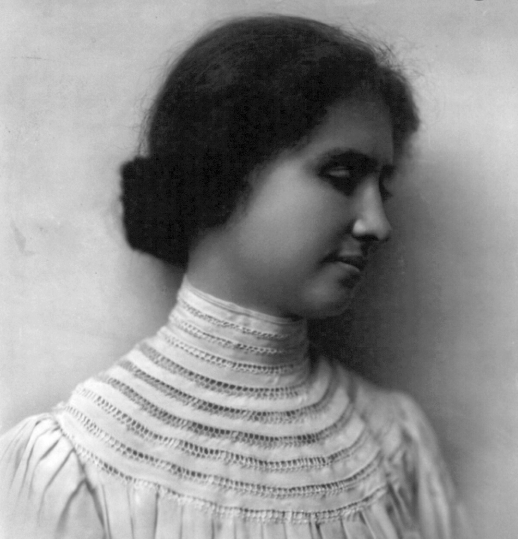
Children’s role models play an important part in their development as good citizens.