Height data from the Queensland CensusAtSchool is used to explain how to calculate averages of grouped data.
Rotate your phone
Once that’s done you’ll be able to experience the CensusAtSchool website perfectly.
Once that’s done you’ll be able to experience the CensusAtSchool website perfectly.

Height data from the Queensland CensusAtSchool is used to explain how to calculate averages of grouped data.

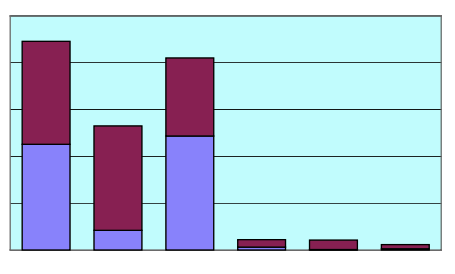
A Simple worksheet asking pupils to draw A tally table and bar chart and discuss some issues about the data.

Uses data from CensusAtSchool to produce a scatter graph of girls and boys’ foot sizes and invites pupils to draw conclusions from the data.

Simple sheet emphasising the need for all graphs to have useful titles, labels, and keys.

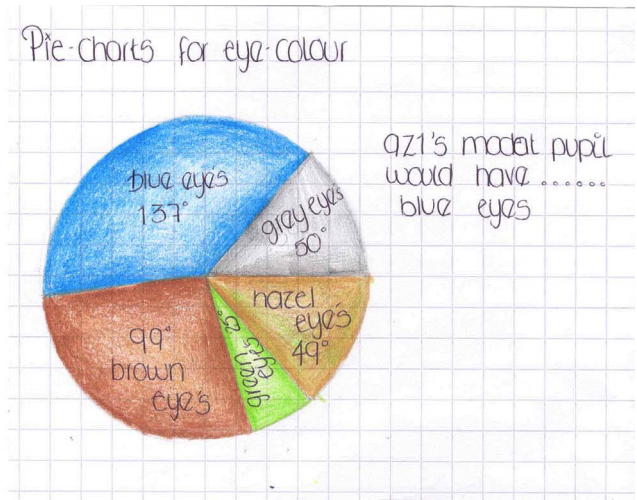
Descriptions of modal pupils using the data both from the original CensusAtSchool data and Phase Two. The task encourages pupils to discuss and think about the merits of using averages.

Uses Excel to look for a relationship between height and foot size. This resource was created by Deborah Stanley of Simon Langton Girls’ Grammar School, Canterbury, our thanks to her for allowing us to reproduce it here.

An explanation of how and why we use scatter diagrams and lines of best fit, posing questions for pupils to explore and think about.

Can your students understand this time-series graph showing the teams being voted as likely to come bottom of the English Premiership during the football season 04/05? Easier for students with an interest in football but accessible for all.

A full lesson plan plus dataset and worksheet designed to help children understand the different types of average and how to calculate and compare them.