How do define a sample? Is your view the same as a mathematician or statistician would use? In what situations are samples useful?
Rotate your phone
Once that’s done you’ll be able to experience the CensusAtSchool website perfectly.
Once that’s done you’ll be able to experience the CensusAtSchool website perfectly.

How do define a sample? Is your view the same as a mathematician or statistician would use? In what situations are samples useful?
This resource is based on key concepts needed by students to understand basic Statistics. Pairs are asked to discuss statements on cards and decide, with justifications, if the statement is True, False or Sometimes true. Solutions are provided in a separate file.
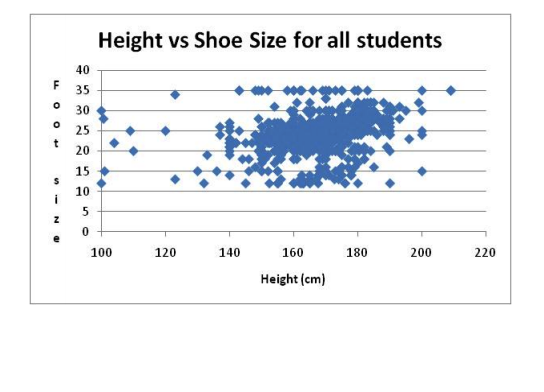
Uses data from CensusAtSchool to produce a histogram of foot sizes of over 860 Irish school children aged between 12 and 20 and invites students to draw conclusions from the data.

Investigate the correlation, lines of best fit and probability in the context of the famous board game.
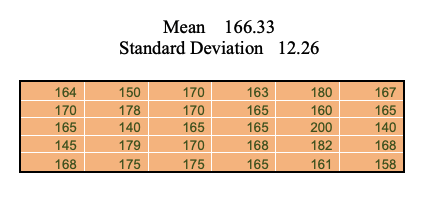
Means, Standard Deviations and Histograms for senior students. CensusAtSchool height data is used to investigate what happens when you add your own data and also looks at True histograms.
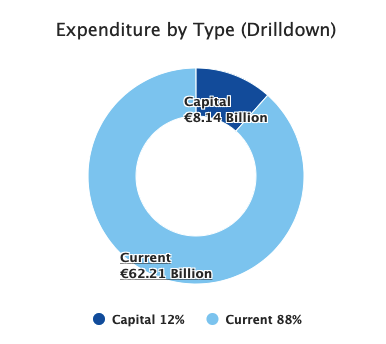
Data to work with and student worksheets on the theme of Government spending. Data is provided based on both 2008 and 2011 figures — all have been sourced from the Central Statistics Office.
The resources have been designed so that you can use them in whatever context or way that you wish. The data are sourced from the Central Statistics Office. In the Excel file, you will find data for the years 1973, 1990, 2008 and 2011. These are available for you to use to make comparisons over time. Note the changes in units from 2008 onwards from millions to billions.
Along with these data tables is a pie chart to show the spending for 2011. This could be used as an OHP/Whiteboard exercise where students guess and reveal hidden labels/titles. The other two worksheets give exercises based on the 2011 data. The activities themselves are self-explanatory and can be used as either main activities or homework.
Examines how students travel to school using data sourced from the Central Statistics Office. Creating graphs and analysis from traveling to school data.

Explore the features of a good questionnaire by examining the style of various sample questions and identifying the different answer types.
In this teacher-created lesson, students are encouraged to examine the archived CensusAtSchool questionnaires. Students should also be allocated time to design their own questionnaires and evaluate questionnaires created by their peers.