BACK TO GET DATA
2007/2008
Latest
CensusAtSchool 8 Results
The results are in, the data has been cleaned and some analysis performed by the CensusAtSchool team. ‘What did the CensusAtSchool 8 census results tell us?’ I hear you ask. Read on to find out…
– Interesting findings from results:
- This year, just over 14000 school pupils and teachers from around the world completed the online survey. Of these, 97% were from UK schools and 49% were male. Just under half (46%) of those inputting data speak only one language (you should be able to guess which this is!), 32% speak 2, 14% speak 3 and the rest speak more than 3 languages – speaking enough to hold a basic conversation.
- Despite being high on the news agenda this year for their dominance, the proportion of people travelling to school by car is consistent across the age groups at 25-30%.
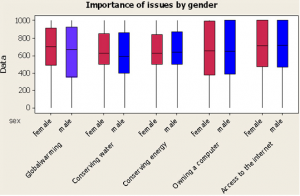
- Girls and boys views of important issues were broadly speaking consistent. At least 75% of girls felt that global warming, conserving water and energy and access to the internet are important issues. This compares with at least 75% of boys considering energy conservation and internet access important. Boys and girls shared almost identical views on access to the internet and owning a computer.
- On endangered species, there was a wealth of support from the female respondents for the dolphin – around 14 species of which are on the 542 strong endangered species list. Support for the tiger prevailed for the boys – although not such an outstanding candidate. For boys the tiger is followed by the polar bear and then the dolphin in third.
- 72% of respondents know that penguins are from Antarctica with a slight variation in the proportion of correct responses with girls compared with boys – 74% of girls hit the nail on the head compared with just 70% of boys. On the contrary, just 16% of respondents knew that Anteaters are native to Africa and 19% recognised Llamas as South American. Thus overall, 22% of those answering could place none of the animals in their native continent. 3% placed 5 or 6 animals correctly.
- Reality TV is the new big thing in broadcasting. Within Phase 8 we asked respondents their opinions of it – a staggering 75% of girls watch reality TV at least occasionally, compared with 59% of boys. Although a quarter of respondents vote occasionally on the shows, less than 1% vote a lot. 36% of YP would like to appear on reality TV with an additional 30% being unsure. Of those who consider themselves to vote ‘a lot’, a massive 67% would like to appear on a show with a further 14% as yet uncertain. In all, 32% of respondents were not interested in appearing on any of these shows – with more boys expressing their negativity than girls. Reasons provided include that its embarrassing, a waste of time, degrading and invades your privacy. 176 of respondents sited shyness as their prohibitive factor.
- What next? Now you have an idea of some of the things that the phase 8 data showed us, you might have thought of some questions that you’re interested in exploring – have you wondered if people from different regions view reality TV differently? Or at different ages? You could download a sample of data and investigate your question more – or you could have a go at the 10 quick questions on the phase 8 results to check if you’re on the ball.
1. What percentage of phase 8 respondents speak more than 3 languages?
2. What age group has the highest proportion of bus use according to the results?
3. What is the percentage?
4. Can you put this in context with the other forms of transport and explain why it’s the highest?
5. Can you predict which region has the highest travel by train to school?
6. How would you use the data to investigate this?
7. Which species shows the biggest range between numbers of female and male supporters?
8. Which species shows the smallest?
9. Can you explain some possible reasons for these being different?
10. What reasons can you think of that might explain the uniformity of girls and boys that think owning a computer and access to the internet are issues of importance?
- Answers:
1. 8%
2. 18
3. 50%
4. –
5. London
6. –
7. Dolphins
8. Hummingbird
9. –
10. Issues that directly affect their daily lives?
- Below are two fixed random samples of the data consisting of 100 records each.
Sample 1 (XLS)
Sample 2 (XLS)