BACK TO RESOURCES

Statistics
Bottom Of The Pile!

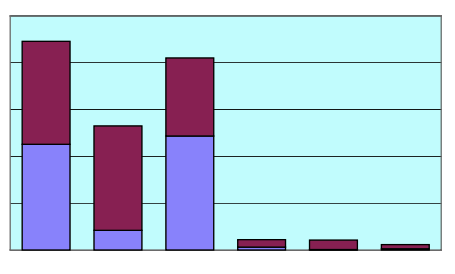
Can your students understand this time-series graph showing the teams being voted as likely to come bottom of the English Premiership during the football season 04/05? Easier for students with an interest in football but accessible for all.


