Ways to find out those accidental and not so accidental errors in your results!!!
Rotate your phone
Once that’s done you’ll be able to experience the CensusAtSchool website perfectly.
Once that’s done you’ll be able to experience the CensusAtSchool website perfectly.
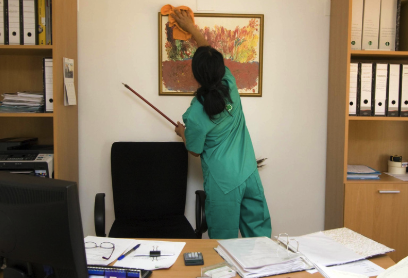
Ways to find out those accidental and not so accidental errors in your results!!!

A simple straightforward worksheet, asking students to collect some information and present it as a graph.

Helps students define the differences between Censuses and samples, with examples.
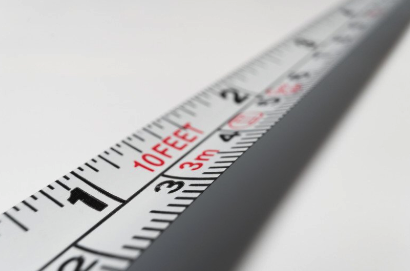
If you choose 16 random feet and put them into a line do you always arrive at the same total length? Using a 16th-century description of a “Rod” length students are asked to take random samples and think about measures and averages.
Here is a set of data with little background. Students are invited, via a series of questions, to turn the data into usable, useful information applying both Mathematical reasoning and use of Statistical methods. It encourages the use of spreadsheets as a means to further enhance the quality of the work and provides scope for further investigation.
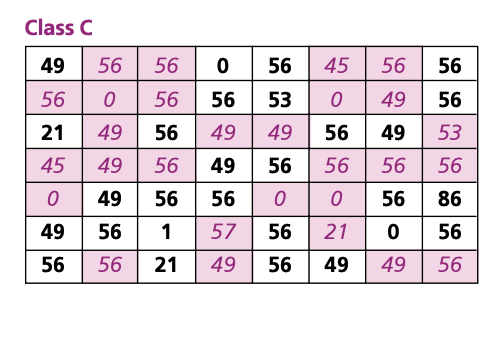
Another set of data for students to investigate. The gender of the provider of each data item is given and students are asked to compare males with females. They have to discover all about the data and what information it is giving them.

Suitable for Leaving Certificate level. These task models the height data taken from the pilot of CensusAtSchool to a Normal distribution. Students are asked to check the data against a Normal and to calculate some Z values, relating them back.
Looks at what samples are and how they can be used. Allowing students to compare their small sample against some initial CensusAtSchool results. Discussion provoking.

Encouraging students to examine data carefully to try to determine where bias may be unintentionally introduced into data.